Zambia’s Kwacha Rallies to 16-Month High
19/06/25
By:
Munyumba Mutwale
Zambia’s Kwacha Rallies to 16-Month High
19 June 2025 at 12:00:00 am

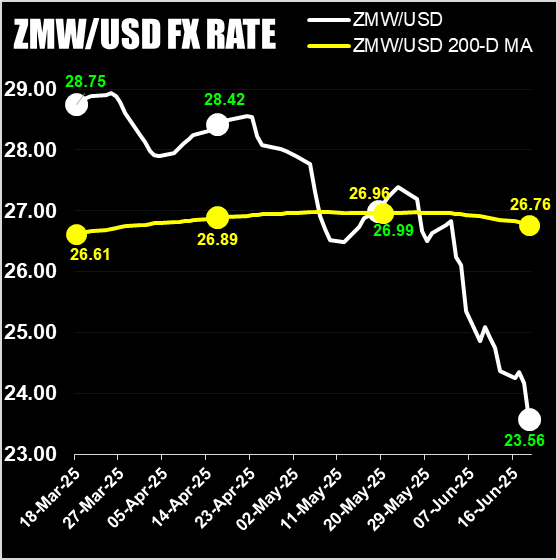
Today, the Zambian Kwacha (ZMW) closed at 23.4557/USD, marking its strongest level since 1st March 2024, and with an appreciation of 2.52%, this represents the 3rd best single-day performance since 28 June 2024.
This move continues a persistent rally that has steadily gained traction since late March, pushing the Kwacha to a 16-month high.
But while the appreciation is eye-catching, what’s behind this move? And what could come next?
A Rally Months in the Making
The Kwacha’s strength didn’t start overnight. Signs of appreciation began to emerge in late March, but the rally gained momentum following a key event: Moody’s upgrade of Zambia’s credit outlook in mid-April 2025. Since then, the ZMW has appreciated on 25 out of the last 40 trading days — a clear shift in market behaviour.
What the Chart Is Telling Us: Reversion, Momentum, and a Bending Yellow Line

The 200-Day Moving Average (200-D MA) — shown as the yellow line on the FX chart — is a key long-term indicator. When prices move too far from this average, they tend to revert. However, what’s noteworthy now is that this line has been declining for 17 consecutive trading days — the longest such streak since the post-election rally that followed the 2021 elections.
Back then, positive sentiment drove the Kwacha to strengthen over 332 trading days, up until November 2022. That sentiment later waned due to delays and fatigue around the debt restructuring process, resulting in one of the worst depreciation cycles Zambia has seen, bottoming out in December 2024.
Could we be entering another optimism cycle? Possibly — but this time, investors are watching closely to see how long this rally holds, and whether the 200-D MA continues trending downward.
Why This Isn’t Just About a Weak Dollar
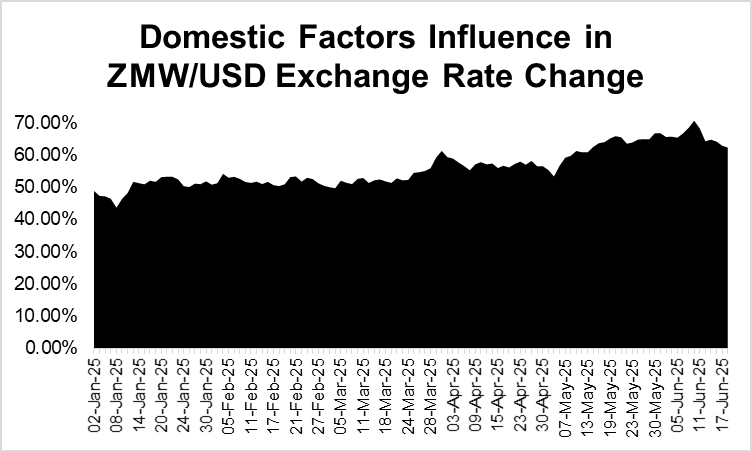
Some may attribute the Kwacha’s gains to global USD weakness, but that’s only a fraction of the story. At ZATU, our FX analysis suggests that 60% to 70% of the recent FX movement is due to the Kwacha itself, not the dollar.
To put this in context:
Over the last 30 days, the USD has only declined globally by 0.95%.
In the same period, the ZMW has strengthened by nearly 14%.
In fact, with geopolitical risks like the Israel-Iran conflict, the USD has seen safe-haven inflows. So clearly, this Kwacha rally is not a USD weakness story, but rather a domestically driven surge.
Our internal model — the “Onion Peel Test” — confirms that the core drivers of this rally are local flows and sentiment shifts, particularly since the Moody’s re-rating.

Short-Term Flows Driving Sentiment
So what could be causing the rally on the ground? It could be any of or a mix of various short-term FX flow drivers, such as:
Mining firms selling dollars,
The Bank of Zambia is intervening with USD sales (but now with lower outstanding demand meaning such a sale has a stronger impact)
Offshore investors are bringing in capital to buy government bonds,
Or even just banks are unwinding USD positions built up over the previous years of poor sentiment and not wanting to get caught on the wrong end of a fundamental-driven appreciation cycle.
These are all event-driven and can create sharp, but temporary, FX movements.
That’s why I generally avoid short-term predictions. The FX market can turn quickly depending on these flows, but that’s also why we use longer-term averages like the 200-D MA to assess overall momentum and trend.
Technicals Show a Market Getting Ahead of Fundamentals
There’s one more reason for caution: the technical indicators are moving faster than fundamentals. We’re seeing:
A bending downward 200-D MA,
Lower highs and lower lows in the ZMW/USD exchange rate,
Momentum is building faster than FX flows.
That means sentiment is leading the rally, not necessarily a surge in export earnings, tourism receipts, or structural dollar inflows. If fundamentals don’t catch up soon, a reversal or correction toward the yellow line could be in the cards.
Moody’s Rerating: The Spark Behind the Rally
While not the core of the story, Moody’s outlook upgrade played a key role in catalysing investor sentiment. Highlights of the rerating include:
Outlook upgraded to positive from stable,
Recognition of debt reduction, fiscal reforms, and projected GDP growth above 5% in 2025,
Increased potential for Zambian assets (bonds, stocks) to be included in portfolios with strict credit rating criteria.
The impact has already rippled across markets:
The Lusaka Stock Exchange Index (LASI) has surged +33.38% year-to-date, reaching an all-time high of 20,595.76.
Since the rerating on 11 April 2025, the LASI is up 26.05% in just 9 weeks.
CEC recently became Zambia’s first $1 billion market cap company.
Sentiment does seem to have shifted, and credit ratings are now playing a more visible role in how investors position themselves across asset classes.
Conclusion: Cautious Optimism, Eyes on the Fundamentals
So, where is the Kwacha heading in the next few months?
In the short term, it may remain strong if inflows continue. But volatility will persist, and a correction back toward the 200-D MA remains a distinct possibility.
In the medium term, if real inflows (exports, FDI, tourism, remittances) rise, then this rally could become sustainable. Until then, consider this: dollars are currently trading at a discount, and sentiment is running ahead of the fundamentals.
The big question for the second half of 2025 will be: Can Zambia’s fundamentals catch up to investor optimism — or will the rally burn out before they do?
Author
I'm a paragraph. Click here to add your own text and edit me. It's easy.
Latest News Articles